
Sample report · representative data
Load Profile and Peak-Shaving Analysis Report
Assessment of the load profile, peak behaviour and storage-supported reduction scenarios based on 12 months of measured consumption data.
- Report no.
- ORN-EN-RPR-001
- Date
- 5 October 2026
- Prepared for
- Sample Industrial Inc.
- Location
- Izmir, Türkiye
Executive summary
Representative dataThis page is a sample report prepared with representative data; it does not belong to a real client and must not be used for an investment decision.
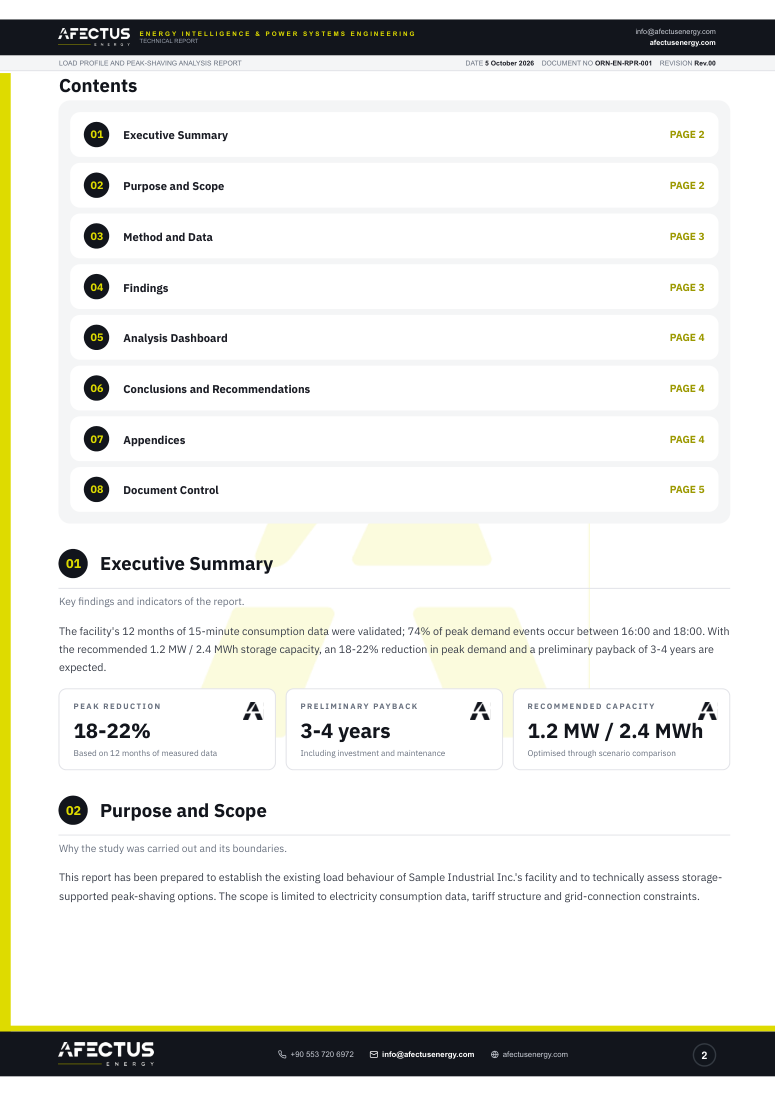
The facility's 12 months of 15-minute consumption data were validated; 74% of peak demand events occur between 16:00 and 18:00. With the recommended 1.2 MW / 2.4 MWh storage capacity, an 18-22% reduction in peak demand and a preliminary payback of 3-4 years are expected.
PEAK REDUCTION
18-22%
Based on 12 months of measured data
PRELIMINARY PAYBACK
3-4 years
Including investment and maintenance
RECOMMENDED CAPACITY
1.2 MW / 2.4 MWh
Optimised through scenario comparison
Purpose and scope
This report has been prepared to establish the existing load behaviour of Sample Industrial Inc.'s facility and to technically assess storage-supported peak-shaving options. The scope is limited to electricity consumption data, tariff structure and grid-connection constraints.
Method and data
Data was taken from SCADA/meter sources at 15-minute intervals, missing and outlier values were validated, tariff components were separated and scenarios were compared in a single dispatch model.
Findings
- Information
Peak demand concentrates between 16:00 and 18:00
74% of annual peak events occur in this two-hour window, a predictable profile that suits storage.
- Favorable
High night-time base load
A base load of 1.0-1.2 MW exists between 00:00 and 06:00; a low-tariff charging window is available.
- Attention
Monthly demand charge approaches the grid limit
In summer the peak reaches 93% of the contracted power; there is a risk of exceeding the limit.
- Attention
Data gaps
Three days of meter data are missing in March; they were filled by interpolation with limited effect on the results.
Analysis screen
The chart is a sample average-day profile; explore it with the pointer, by touch or with the ←/→ keys, and use the legend buttons to show or hide series.
Daily Load Profile (MW)
Sample report · representative data
← Swipe sideways to see the full chart →
Recommendations
- HighTimeline: 2 weeks
Discuss the contracted power and exceedance-penalty risk with the distribution company
- MediumTimeline: 6 weeks
Obtain a preliminary technical specification and price quotation for a 1.2 MW / 2.4 MWh BESS
- LowTimeline: 3 months
Improve the data-collection infrastructure to avoid missing meter data
Conclusion
The existing load profile is suitable for storage-supported peak shaving. Before an investment decision, clarifying the tariff projection and the facility expansion plan is recommended.
Annexes
- Raw consumption data12-month 15-minute dataset (Excel)
- Tariff analysisTable of separated tariff components
- Scenario calculationsSummary of dispatch-model inputs and outputs
The report as a PDF
The same report is also available as a PDF with a document control record and revision number.
Sample Engineering Report
A sample report prepared with representative data (PDF); it does not belong to a real client.
This page is a sample report prepared with representative data; it does not belong to a real client and must not be used for an investment decision.
How would a similar report look with your own data?
Let us define the scope and the data we need from your facility; the study is delivered in the same structure as this report.
Request a technical pre-assessment